WhatsthePayBack.com is unique as it matches projected energy savings to real products and services. Whilst we have endeavoured to make data entry as simple as possible, a certain degree of information is required to enable accurate payback on investment calculations. If time is pressing and you would like an expert to complete it for you, we have a network of approved assessors who can help you assess, manage, install and save.
Top Tips
Follow the green
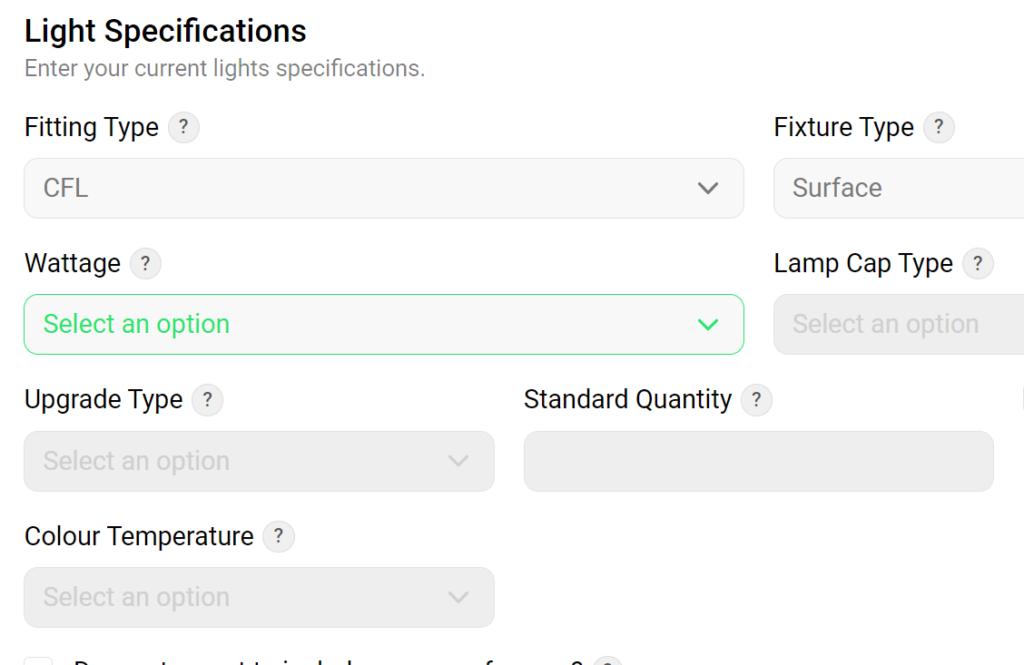
The system requires that data is entered in a particular order. To encourage this, the system highlights in GREEN the next data point that needs to be entered. If you do not enter data in each box highlighted by the system, you will not be allowed to progress.
Question marks have the answer
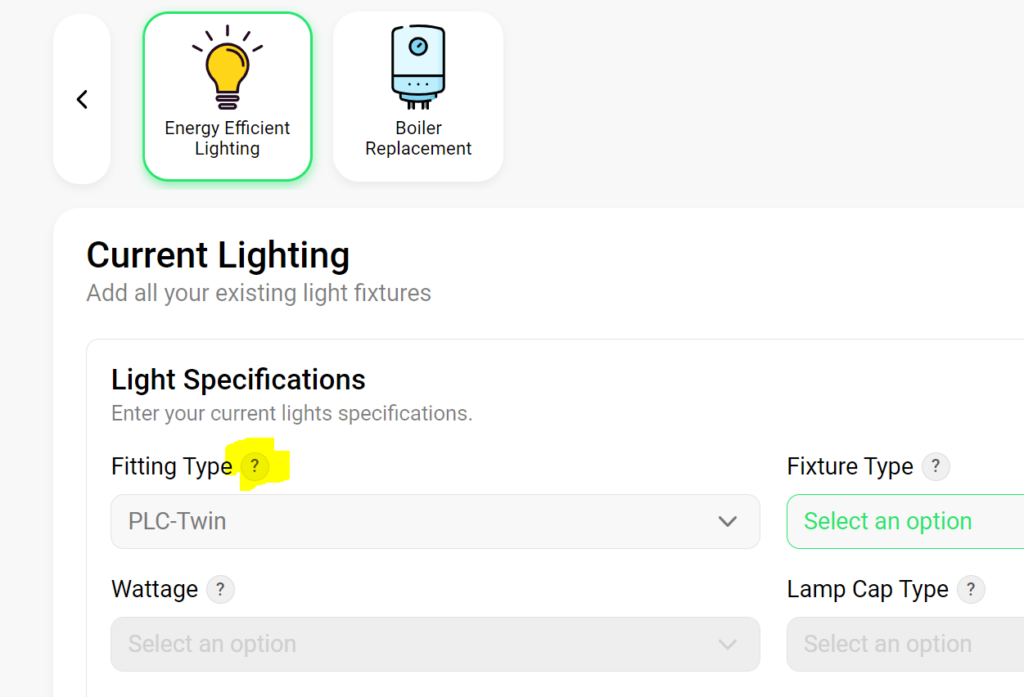
If you are not sure what something means or how to answer a question, click the question mark (?). A helpful tip will pop up. If you are still unsure, please get in contact, we are always happy to help.
Multiple choice
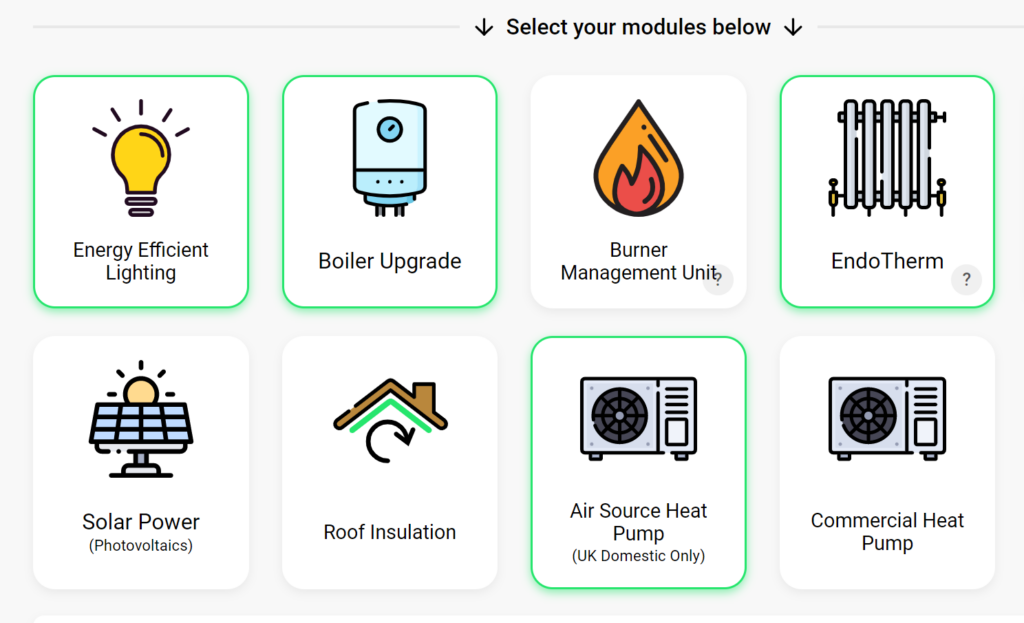
The system allows users to select more than one technology on which to calculate payback on investment and energy/carbon savings. Click the technologies icons you are interested in (they acquire a green outline), scroll down to the bottom navigation bar and press ‘next’.
3 simple steps
To obtain results, users are required to fill in data in 3 different sections.
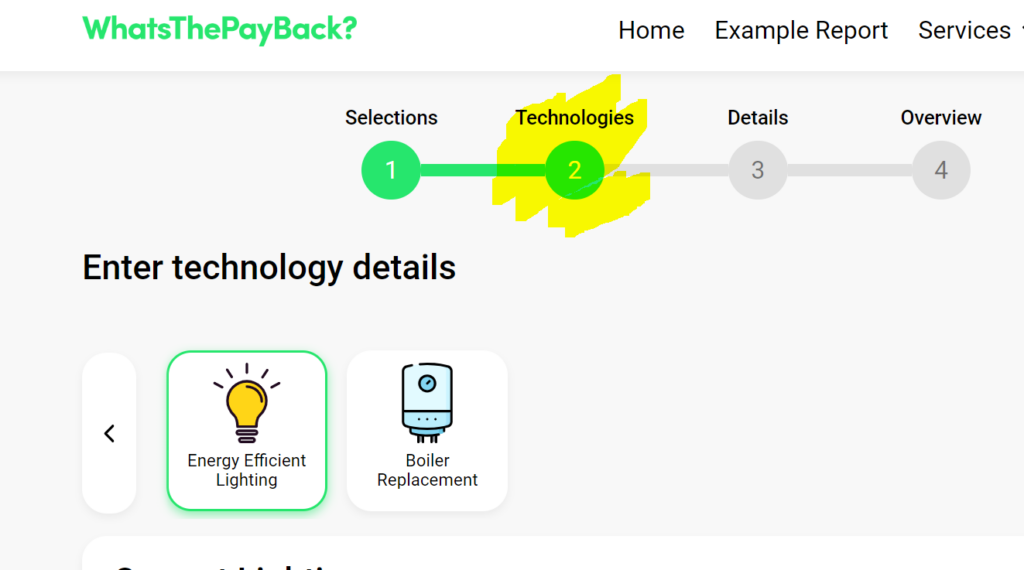
The first section ‘Selection’ is the initial section where users select the technologies they wish to investigate.
The second section ‘Technologies’ is where users enter the current technology and building fabric information (depending on the technology/upgrade being investigated).
The third section ‘Details’ is where users are required to enter building and utility rate information.
After each section is complete, scroll to the navigation bar at the bottom of the page and press ‘Next’.
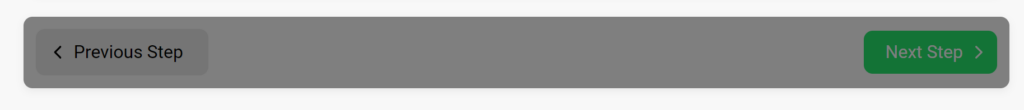
Focus on the navigation bar
The primary navigation bar is located at the bottom of the page. If the bar is greyed out, preventing users from navigating to the next data input section, the system requires the user to enter additional data. Look up the page to see if there is a box highlighted in green requiring your attention.
In addition, the bar provides instructions on data entry requirement and possible errors.
Tabby tab tab...
Selected technologies are represented by tabs. The current activated technology is highlighted in green. You can navigate between these tabs by selecting the icons.
It is best to view these tabs as an old school filing system, where each tab represents a new folder that requires its own data to be entered. If users do not enter complete data in each tab, the system will not allow users to progress to the next data input section.
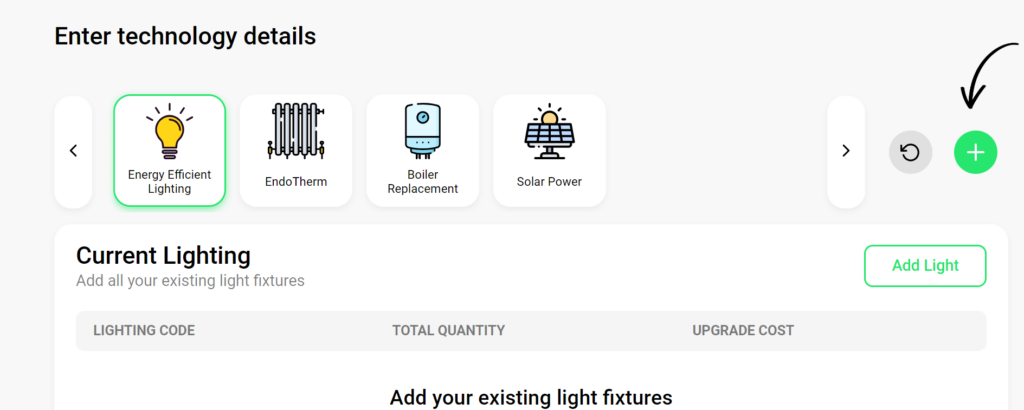
Enter the current site data
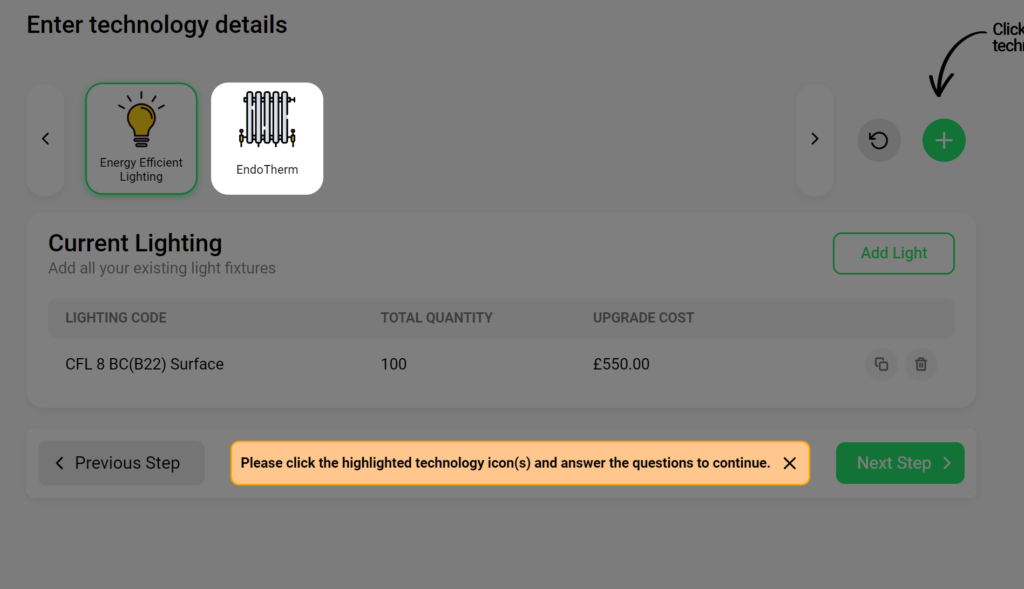
To enter data for each selected technology, click on the technology icon tab. The current selected technology tab is highlighted in green. A data input box appears below. The data input box requires users to enter the information for that technology. In the case of ‘energy efficient lighting’ upgrades, users would select ‘Add Light’. When the data for a particular light fitting has been entered, press ‘Save Light’. Users can then add additional different lights by again clicking ‘Add Light’. When all lights have been entered move on to the next technology, or the next section.
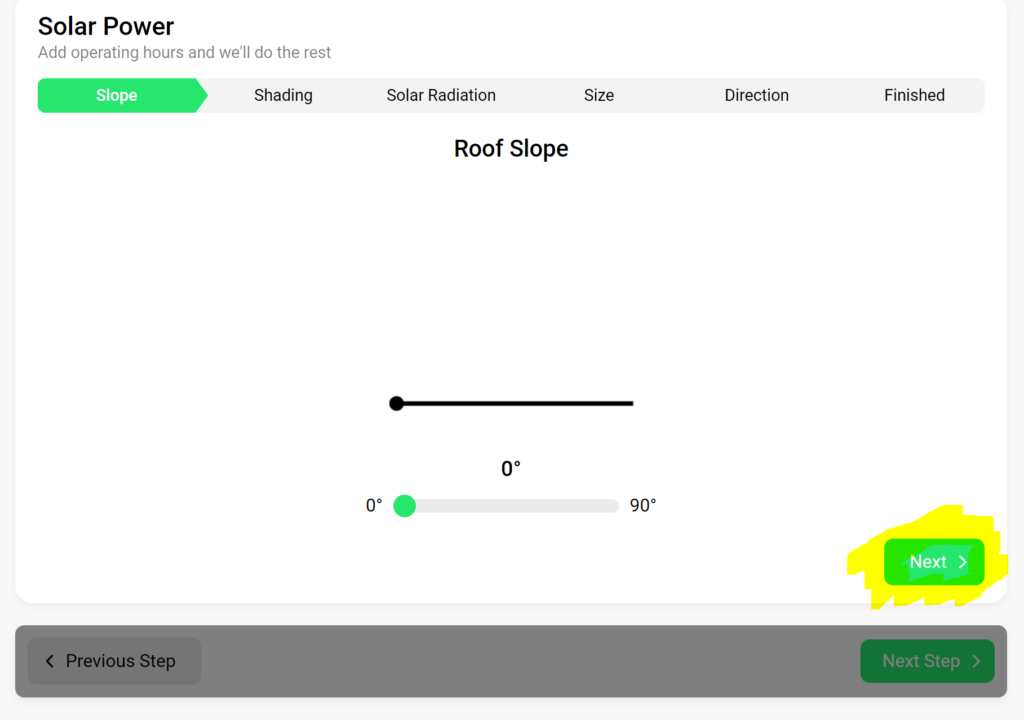
Fill in each sub tab
Where technologies require systematic user input, a new nav bar appears above the greyed out lower navigation bar. Keep entering data, then pressing ‘next’ until the system tells you data input for that technology is complete.
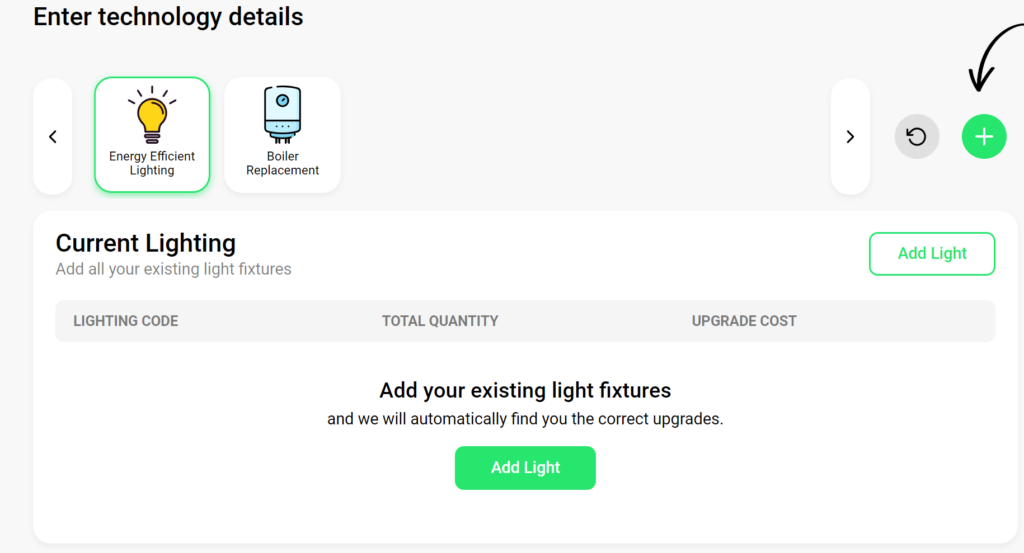
Don't leave me...
The system requires that users enter a full set of data for each technology they have selected. If, after completing one technology tab (e.g. lighting), the user presses ‘next’ without completing the remaining technology tabs they have selected, the system will prevent user from progressing. The system will grey out the screen and highlight the technologies that need to be completed. Click the highlighted icon to proceed to entering data for that technology.
Good data...
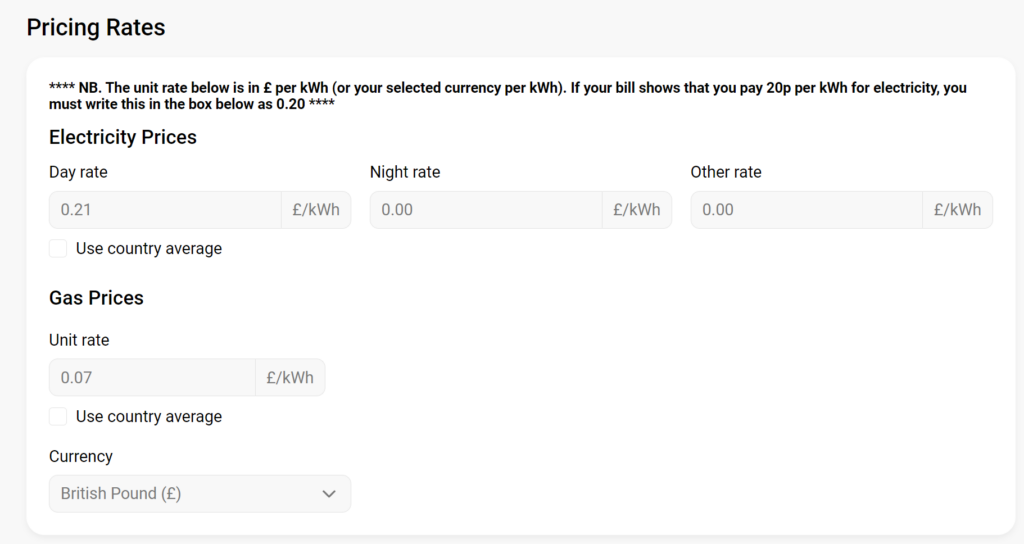
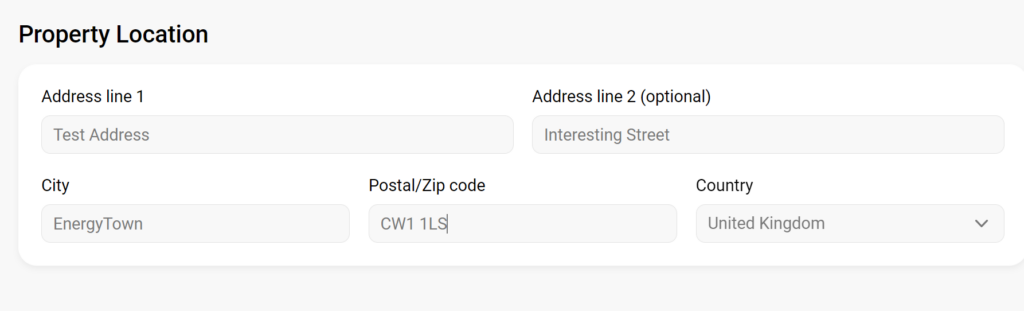
When you have entered all the data in the current ‘Technologies’ section and the system allows you to move on the the ‘Details’ section, the system requires users to enter building and utility information.
It is important that accurate information is entered here as this is what the system uses to calculate your savings. If you do not enter correct utility rate information, the potential saving calculations will be wrong.
It is important to note the system requires you to enter in £’s. so a rate of 21 pence per kWh needs to be entered as 0.21. International users can chose to data enter in $ or €.
For heating technologies (heat pump/boiler upgrade etc.) the system requires 12 months of heating fuel consumption data to be entered. Further clarification can be found here.
Woo Hoo....Results!
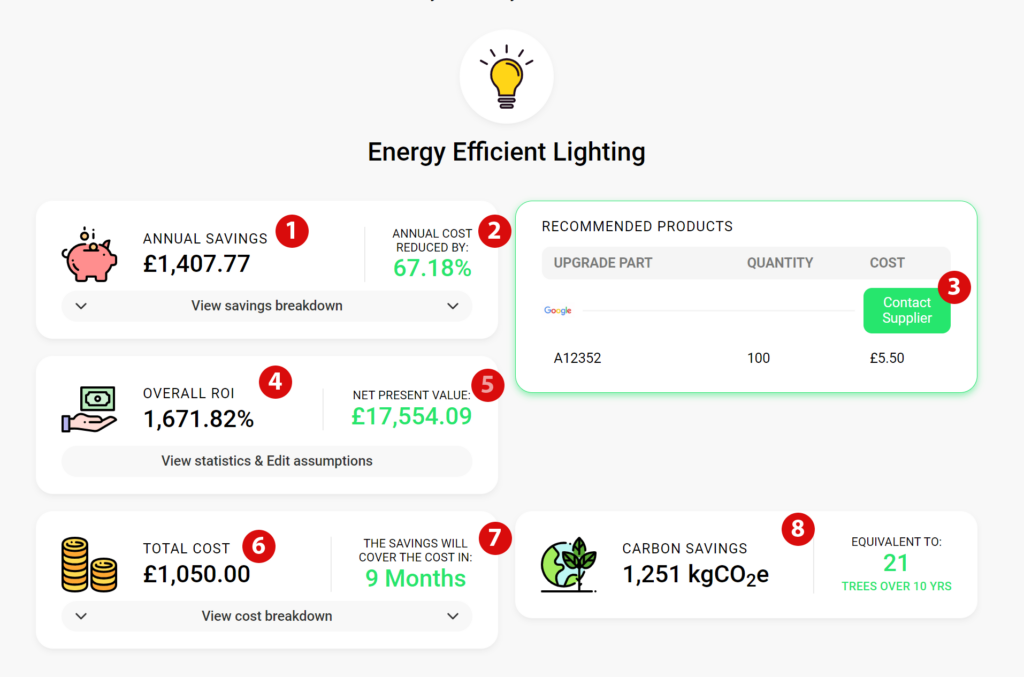
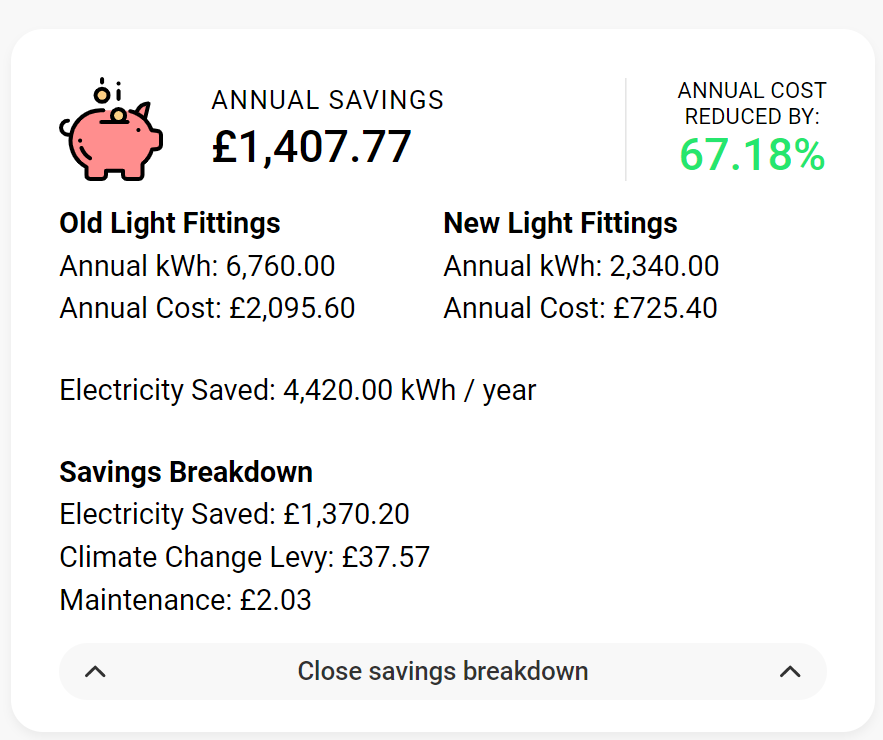
When you have entered the required data on the ‘Details’ section, selected that you have read and agree to the terms and conditions and pressed ‘Next’, you will be shown your results. There is a lot more here than meets the eye.
1 = Estimated annual savings from technology upgrade 2 = % cost reduction each year to run the new technology compared to existing technology. 3 = Results are based on REAL products from REAL suppliers. Click this button to request that the supplier gets in contact to discuss purchase/install of the recommended products. 4 & 5 = Return on Investment calculation. This is an estimate on how much money you will make if you invested in the upgrade now over a 15 year period. In this example, if I invested £1,050 now, over the next 15 years the system estimates I would make £17,554.09 representing a 1,671% return on investment! 6 = Estimated cost to purchase and install the recommended products. 7 = How quickly you will get your money back. 8 = Annual carbon savings
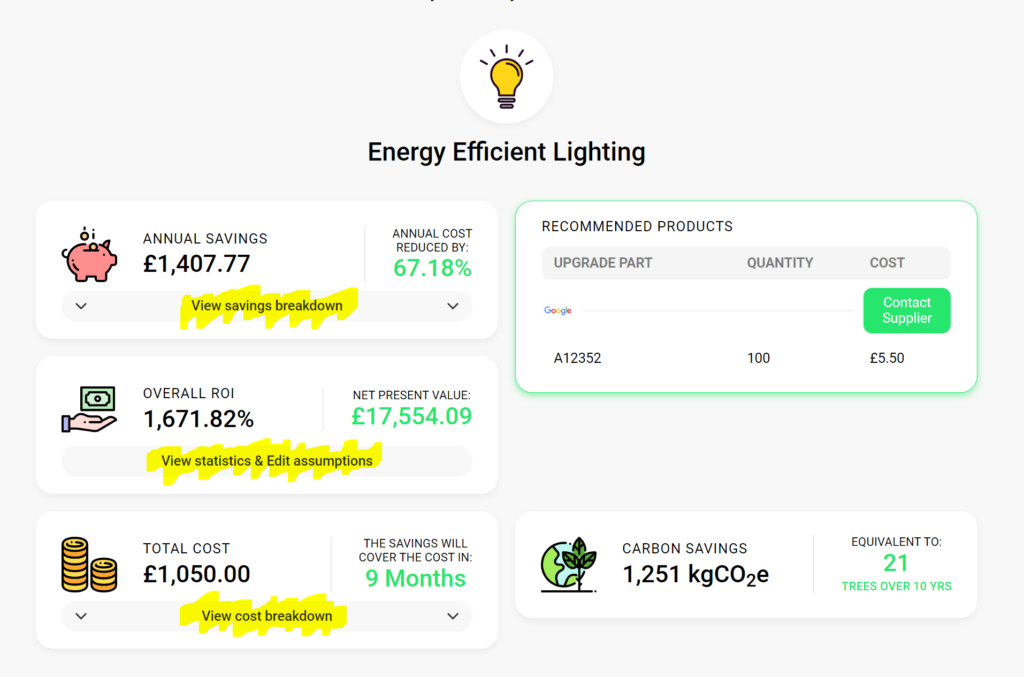
Get the drop...
There is even more information available on the results page. Click the grey bars and additional information will be presented. If you want to try the drop down boxes from this example survey click here: https://whatsthepayback.com/overview?id=2981156
There's even more...
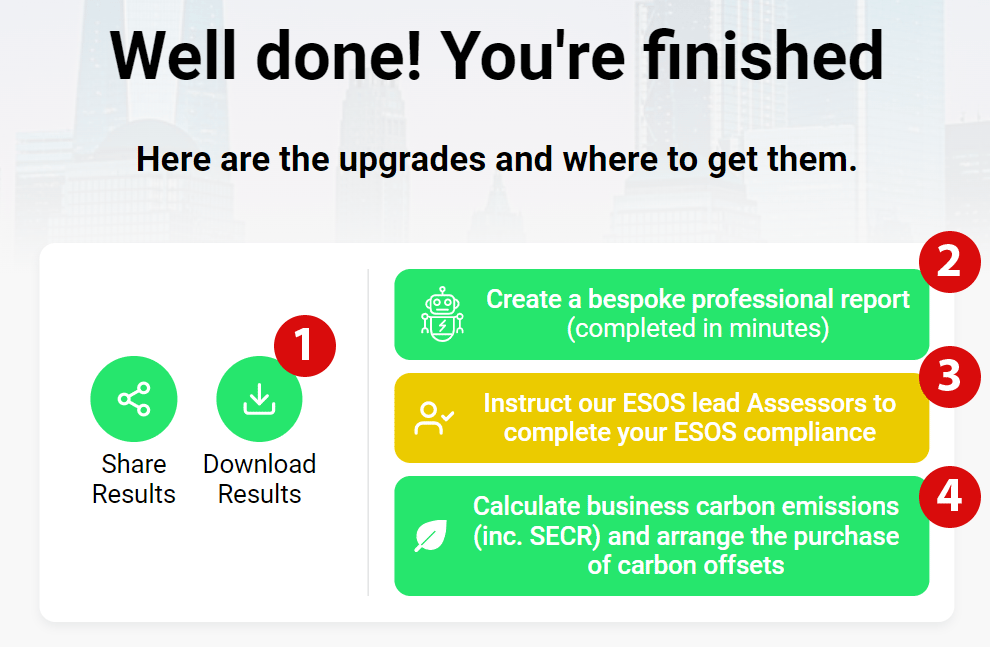
1 = Click here to download your results in a word document which provides an overview of the results. Example here. 2 = Click here to enter the professional report generator. The system can generate an professional report in a couple of minutes. Example here. We will delve in to more detail with the report generator later.
3 = We have a network of sustainability experts who use our system help their clients. Click here to be connected. Our experts can help you comply with energy legislative requirements and reaching Net Zero.
4 = If you want to reduce your carbon emissions and reach Net Zero, click here to be arrange for a sustainability expert to get in touch.
Watch how to go from the results page to a professional report in minutes.
Did you know you can easily produce fully editable Word document using our system? Watch the brief video to find out more.
A bit more detail...
It's getting hot in here...
In the case of heating system upgrades (boiler/heat pumps etc.), the system requires users to enter 12 months of heating consumption data. This is so it can calculate how much the suggested upgrade can save you. It is important that this is accurate (contact us for help if required), and as much as possible be over a 12 month period. The system will automatically interpolate/ extrapolate the consumption entered to a 12 month period, so if you just enter gas consumption for June, this will be extrapolated to 12 months which won’t be very accurate (it would be a significant under estimate of consumption as you wouldn’t have been using gas to heat you building in June).
The system then uses degree days* to adjust the 12 months of consumption to better reflect average energy consumption. If you are UK based, the system automatically does this based on the property postcode (so make sure you enter the correct postcode). If you are international, you can manually add degree days by selecting ‘manual degree day data’.
*Degree days – find out more here: https://www.degreedays.net/introduction
We have created a document that can be downloaded by clicking the button below. Enter the start reading and end reading of a 12 month period and the difference between the two should represent your consumption over that period. You can obtain these readings from your bills, supplier or manually recorded readings. Again, please get in contact if you require help/clarification. Make sure you note if you meter reads in ft3 (old meters) or m3.
If you have a smart meter, you could contact your supplier and ask for your consumption over your selected 12 month period. It should be provided in kWh so conversion to kWh will not be required. If you have online portal to access your utility billing you should be able to obtain the information from there.